AgroData
AI / BI / Geo / CV for agriculture

Intelligent agricultural data analytics

We use drones, video analytics, audio analytics, BI dashboards and AI models to help agribusiness spot risks, raise yields and make precise decisions.

NDVI index

0.74

Soil moisture

42%

Yield forecast

6.8 t/ha

Live field overview

Field 12 · Wheat

Irrigation risk

Medium

Crop health

87%

Disease probability

12%

Water stress

Medium

Yield forecast

+12%

Crop health

Crop condition

87%

Water stress

Water stress

Medium

Yield forecast

Yield forecast

+12%

Detected zones

Focus zones

14

Drone scan

Drone flight

Done

AI confidence

AI confidence

94%

Hands-on experience · surveying & mapping

Orthophotos, land-inventory capture & terrain models—deliverables we have already executed in the field

These workflows plug into the same data backbone that powers farm analytics and AgroData dashboards.

Farm analytics capabilities and the sources we ingest are summarized under What we analyze.

Proven delivery

Drone orthophotos & orthomosaics

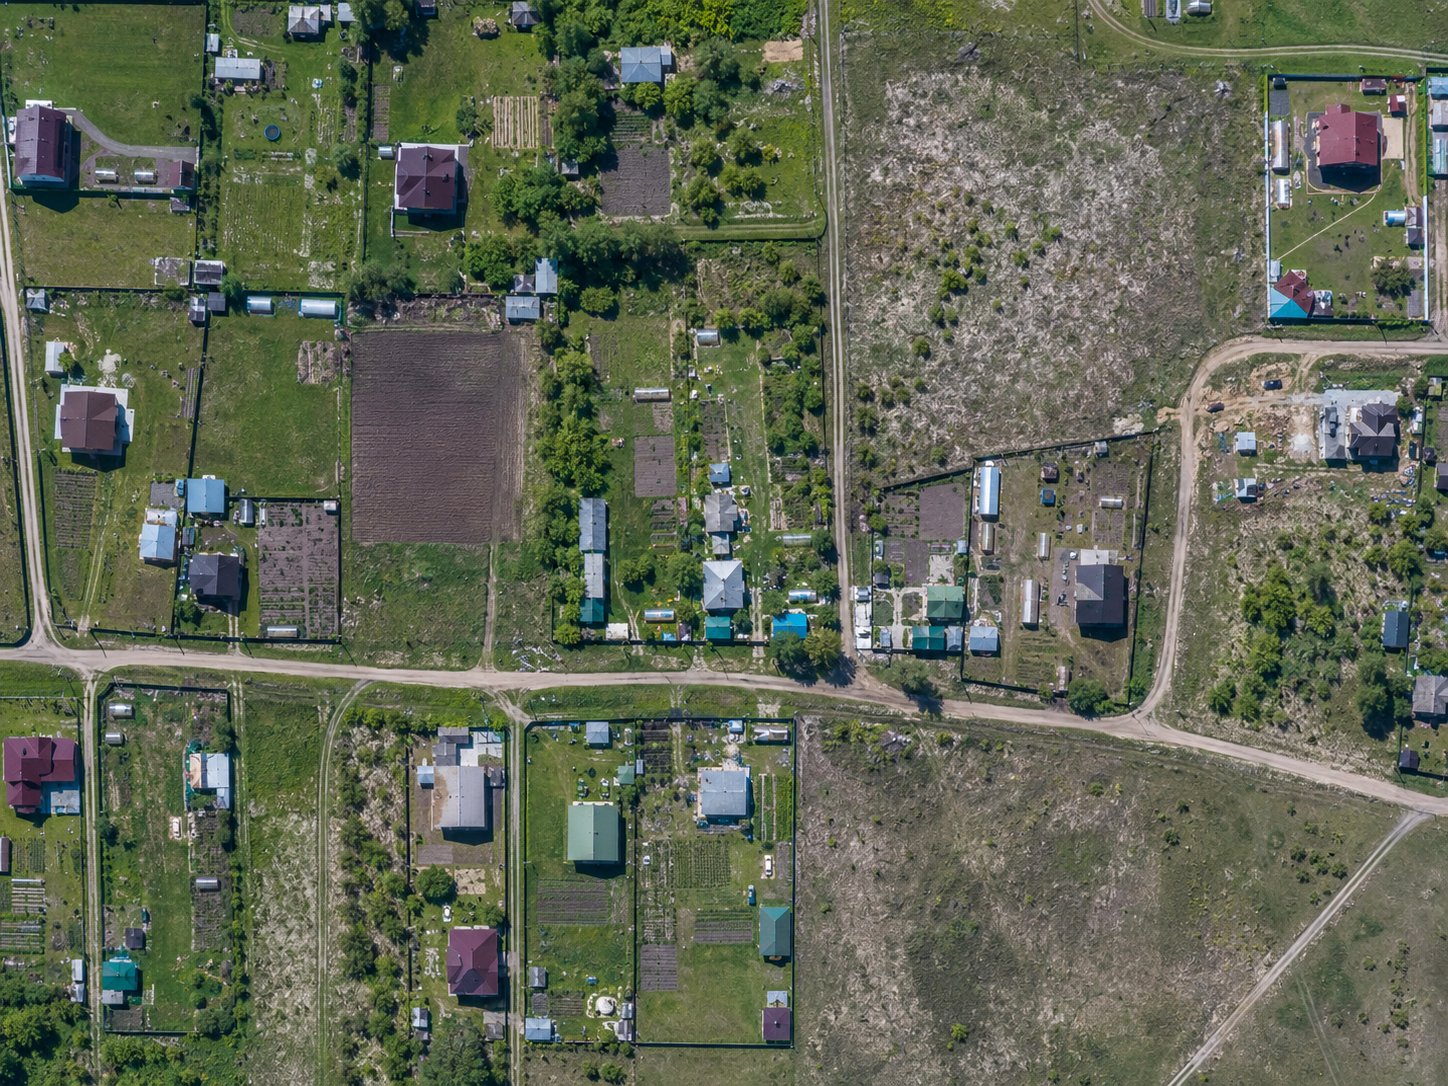
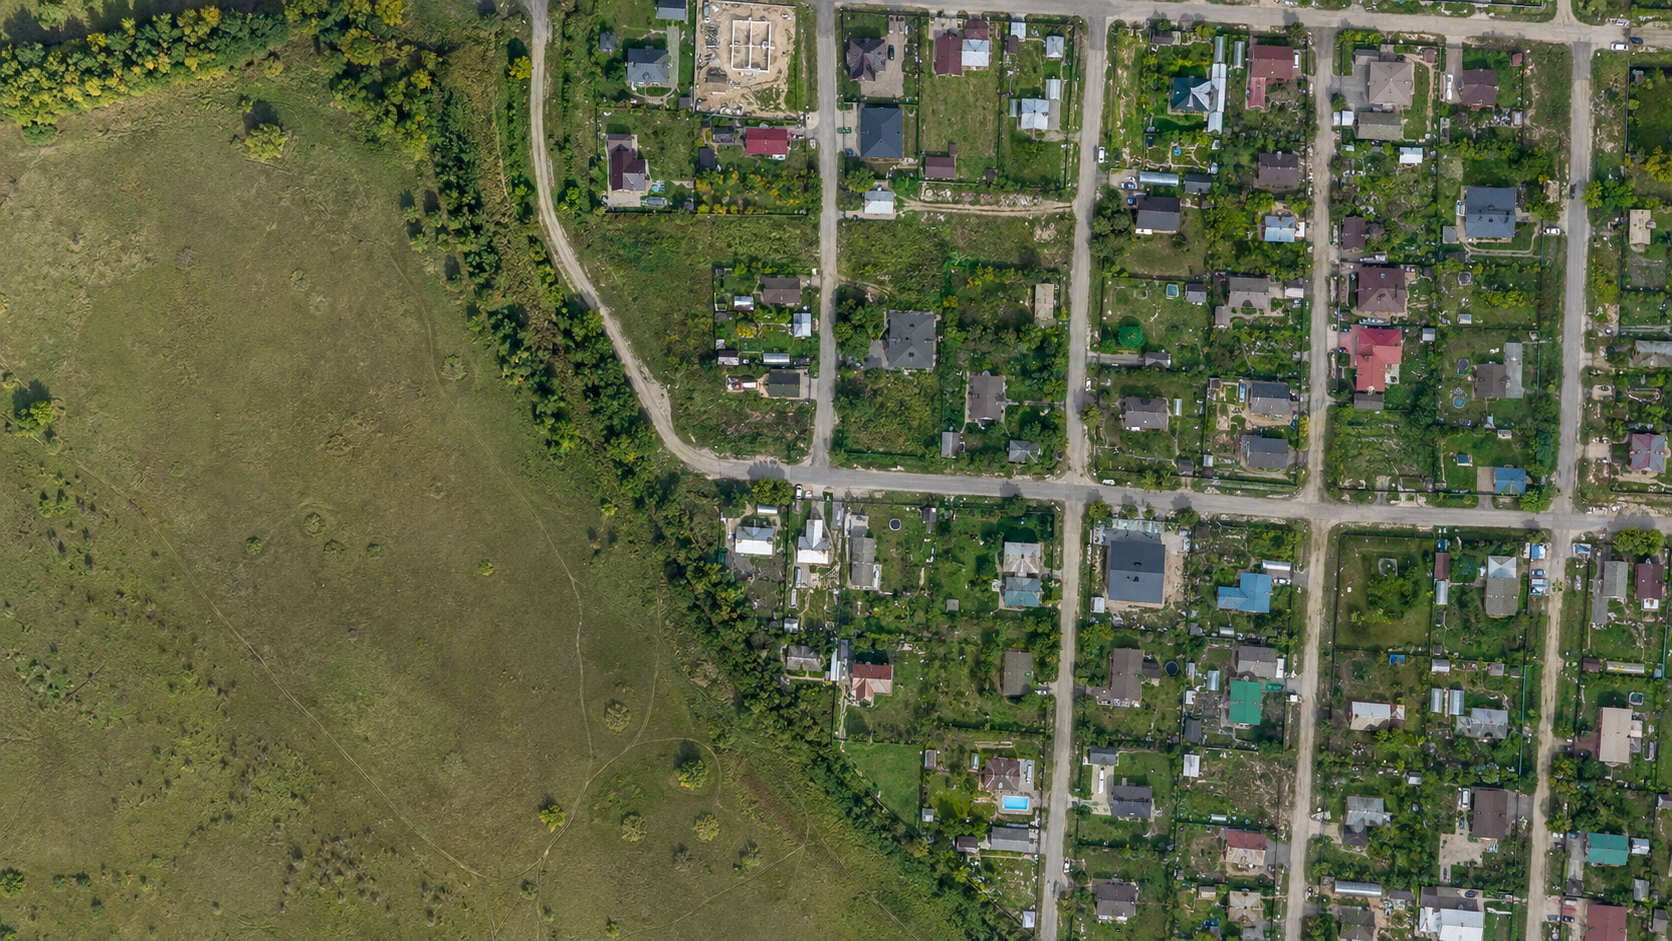
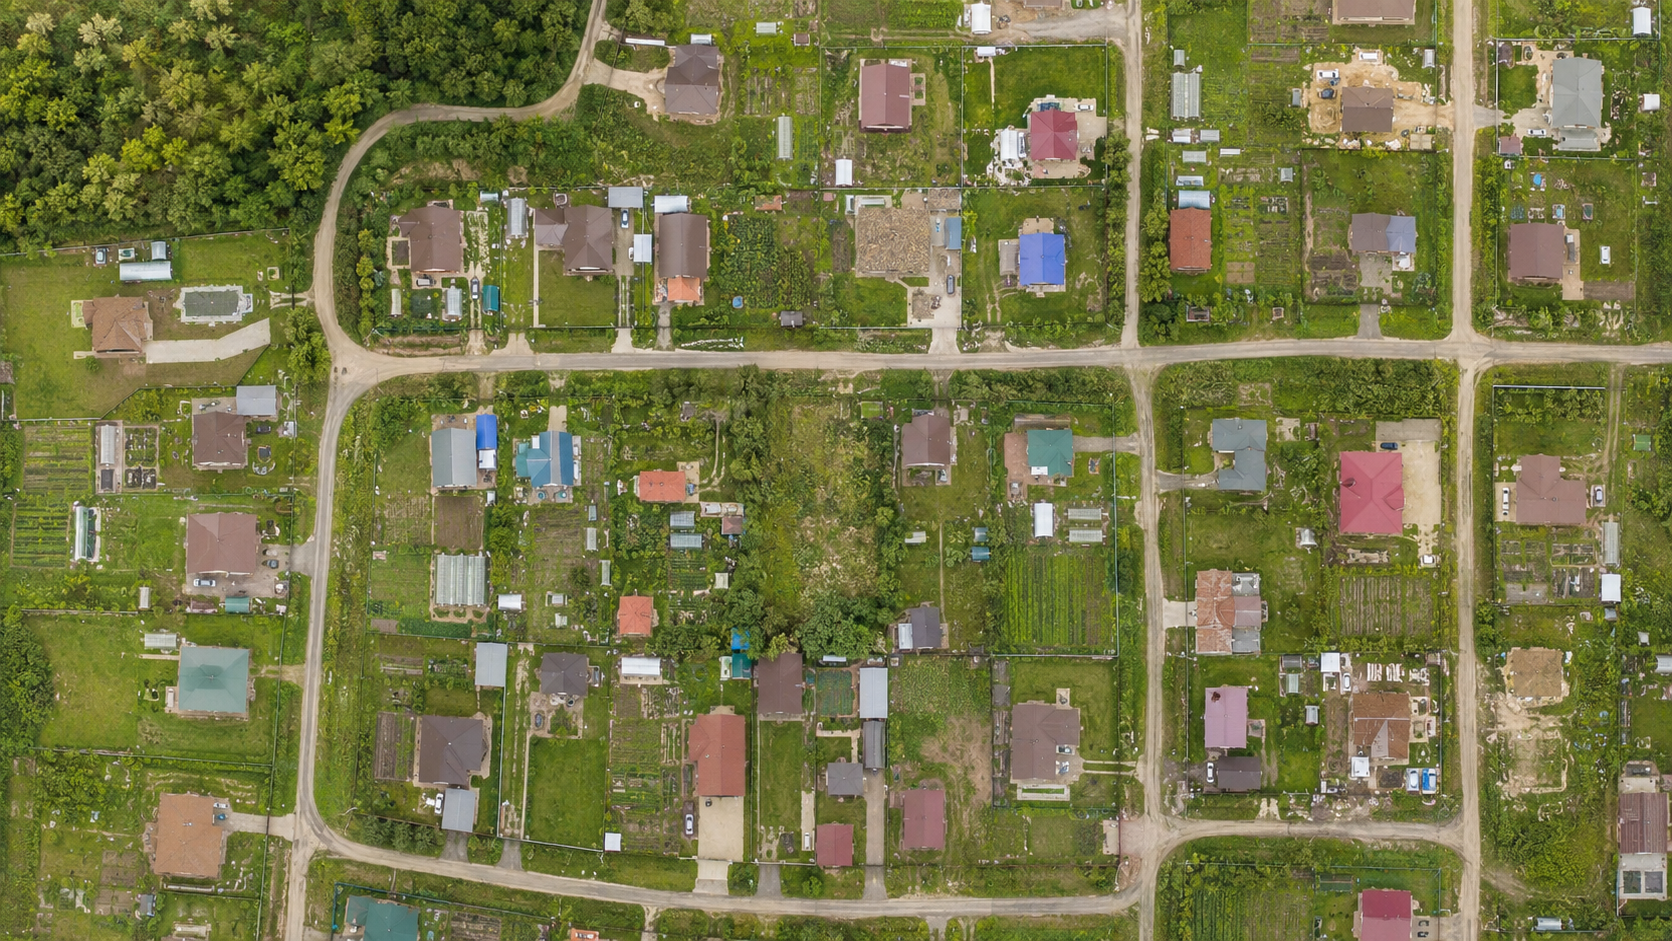
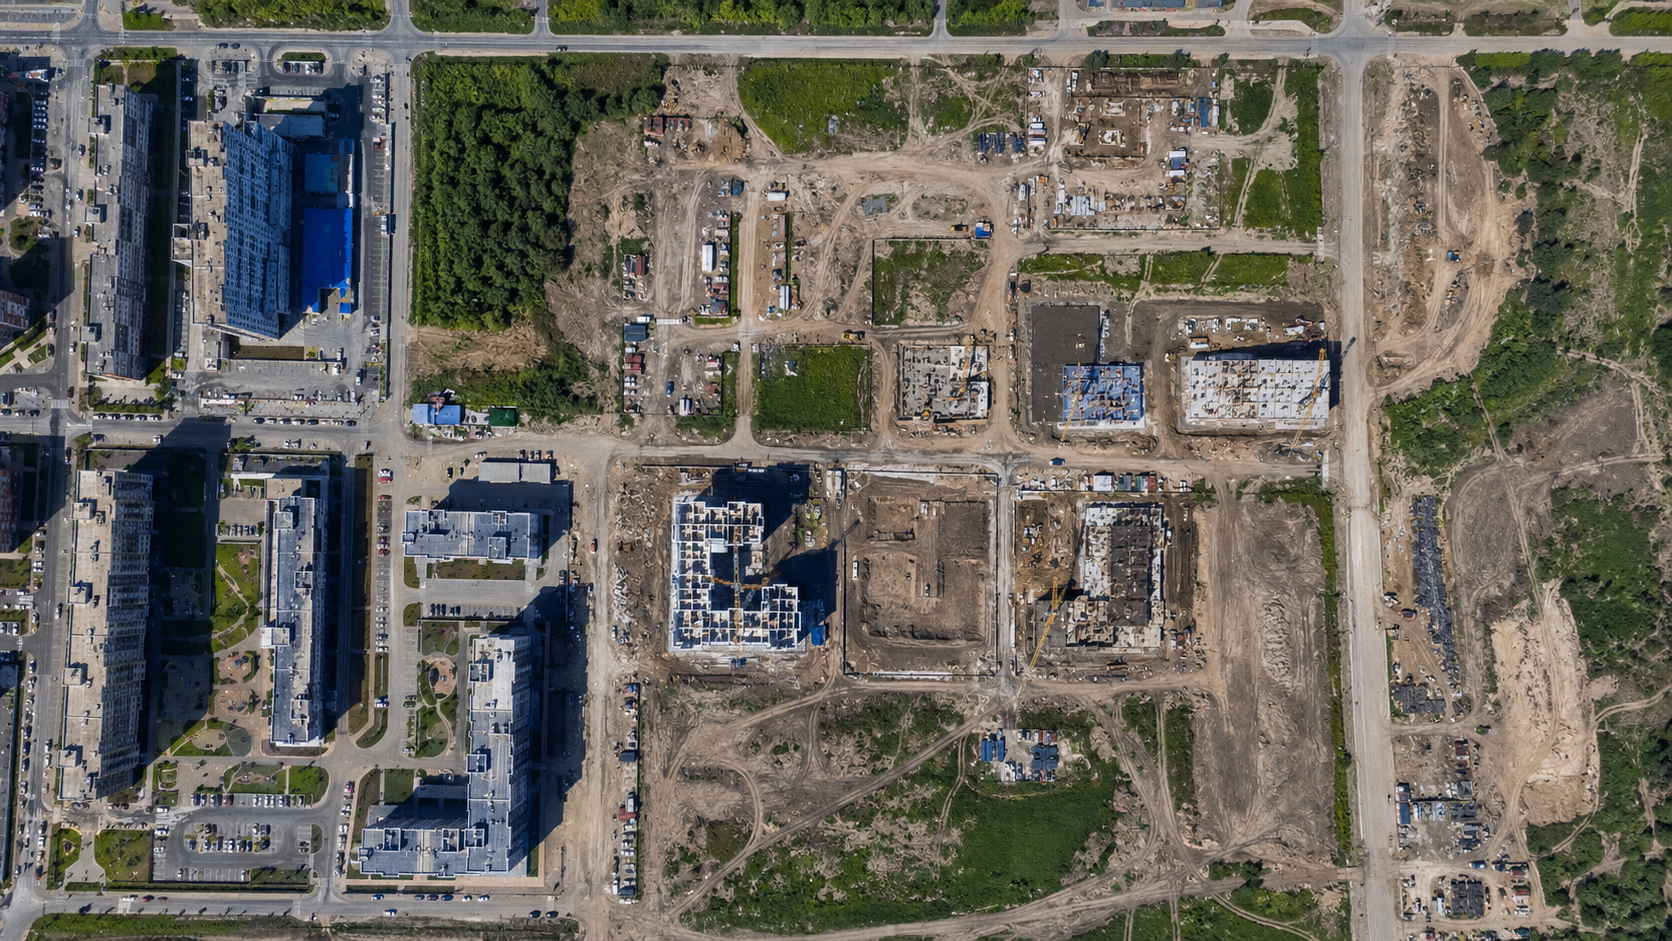
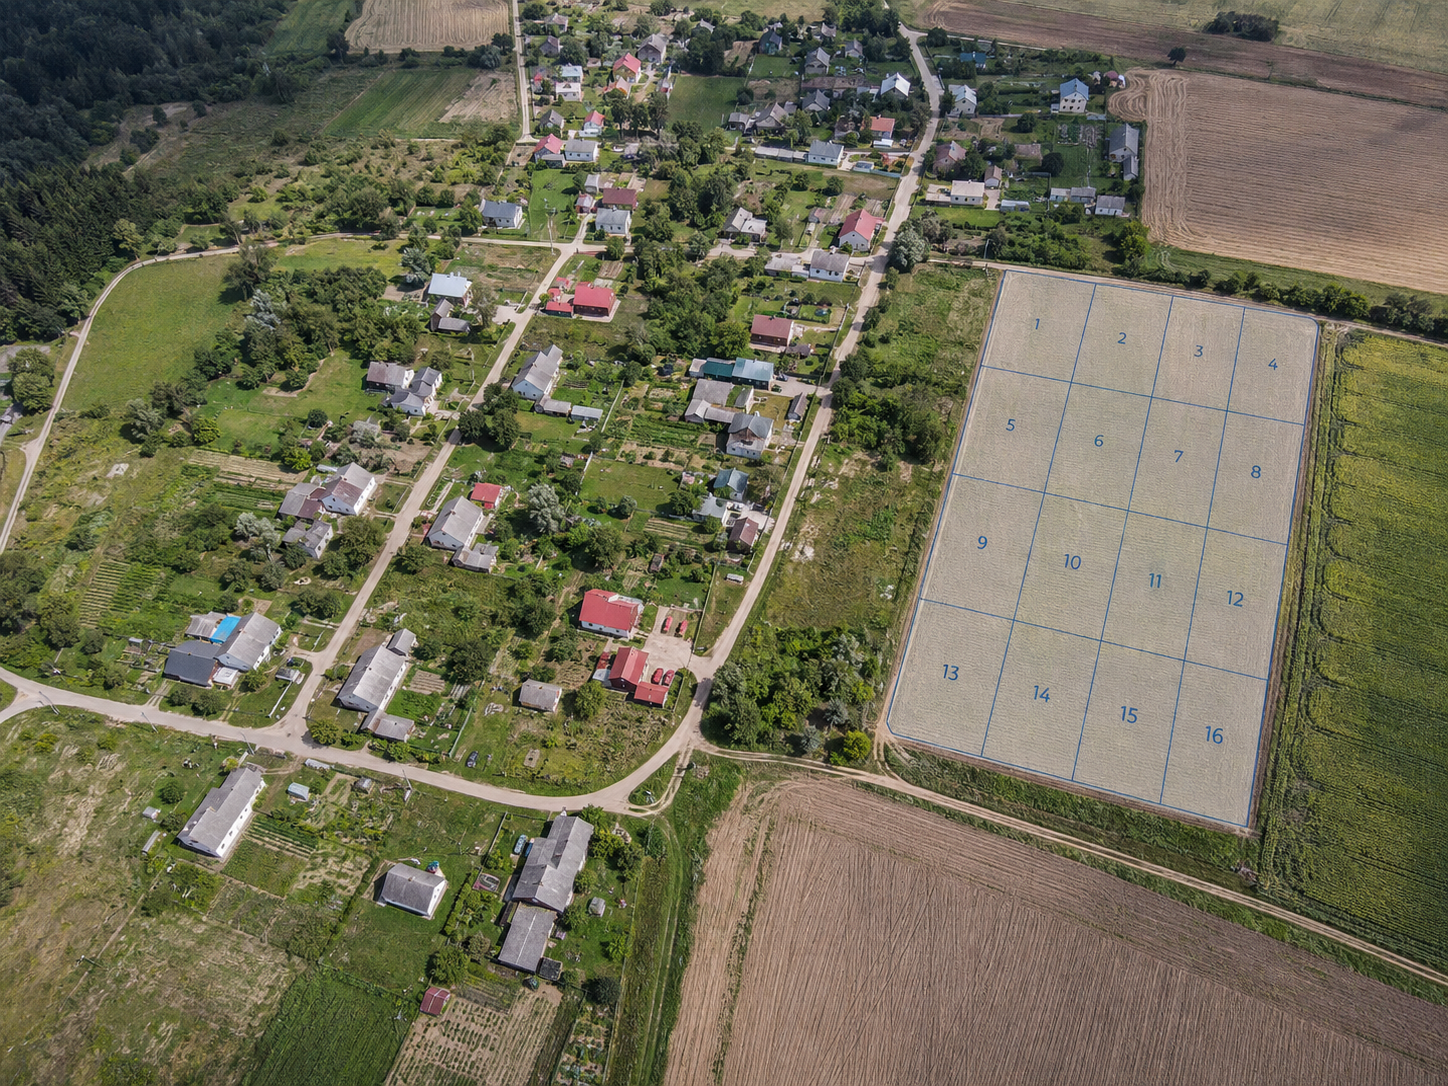
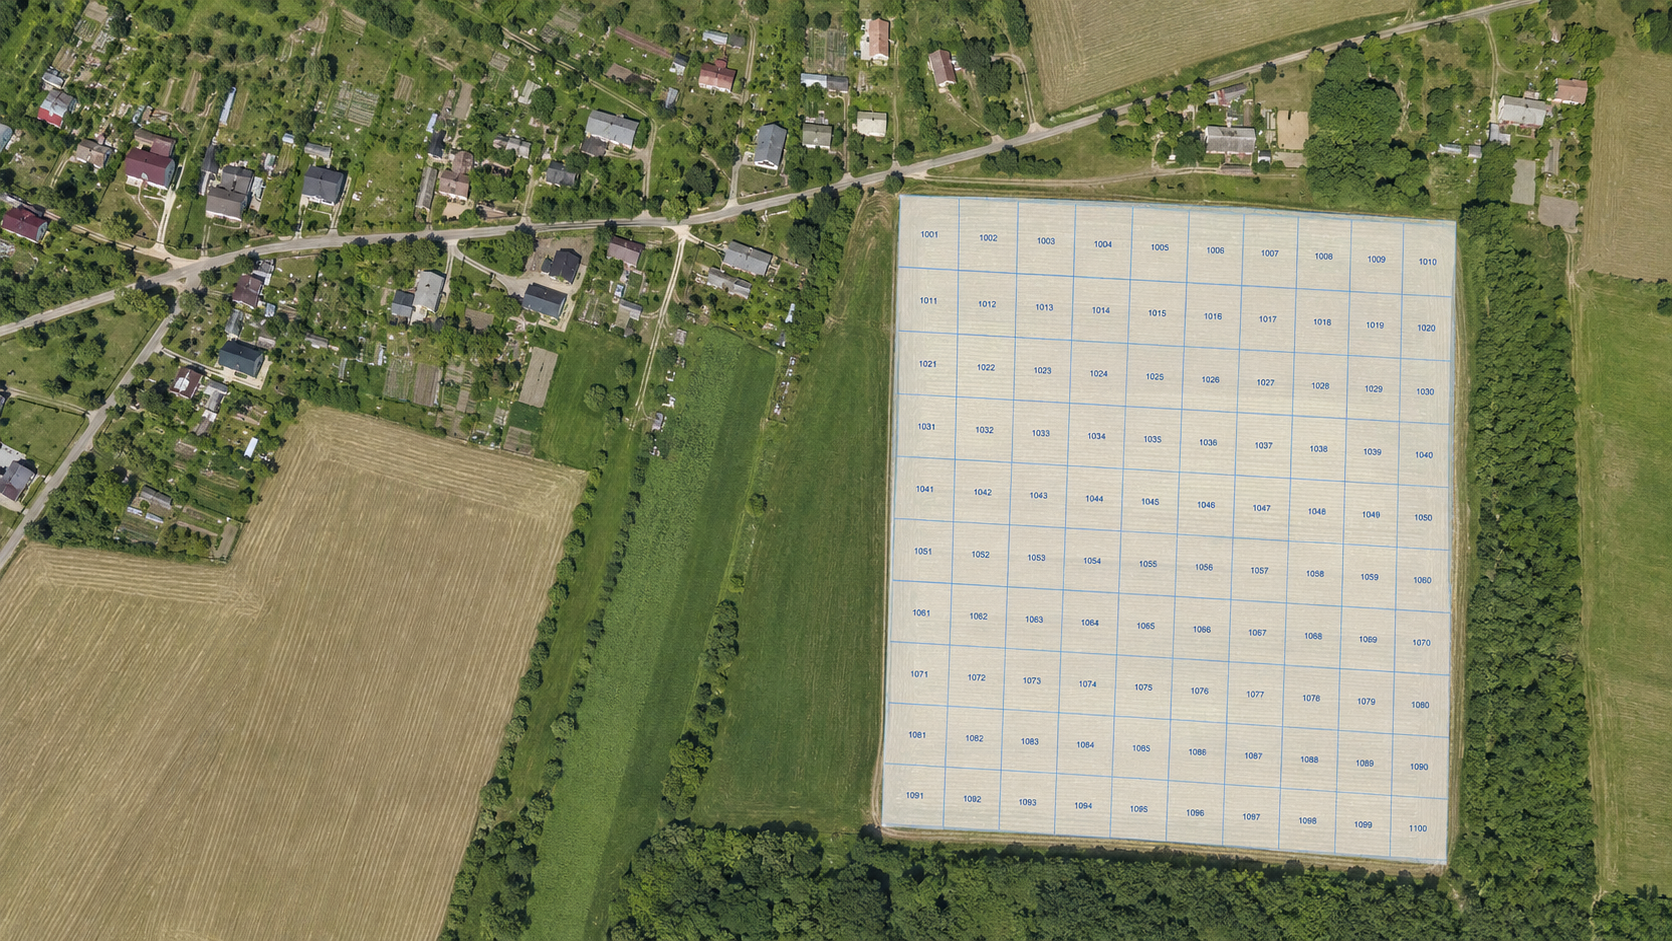
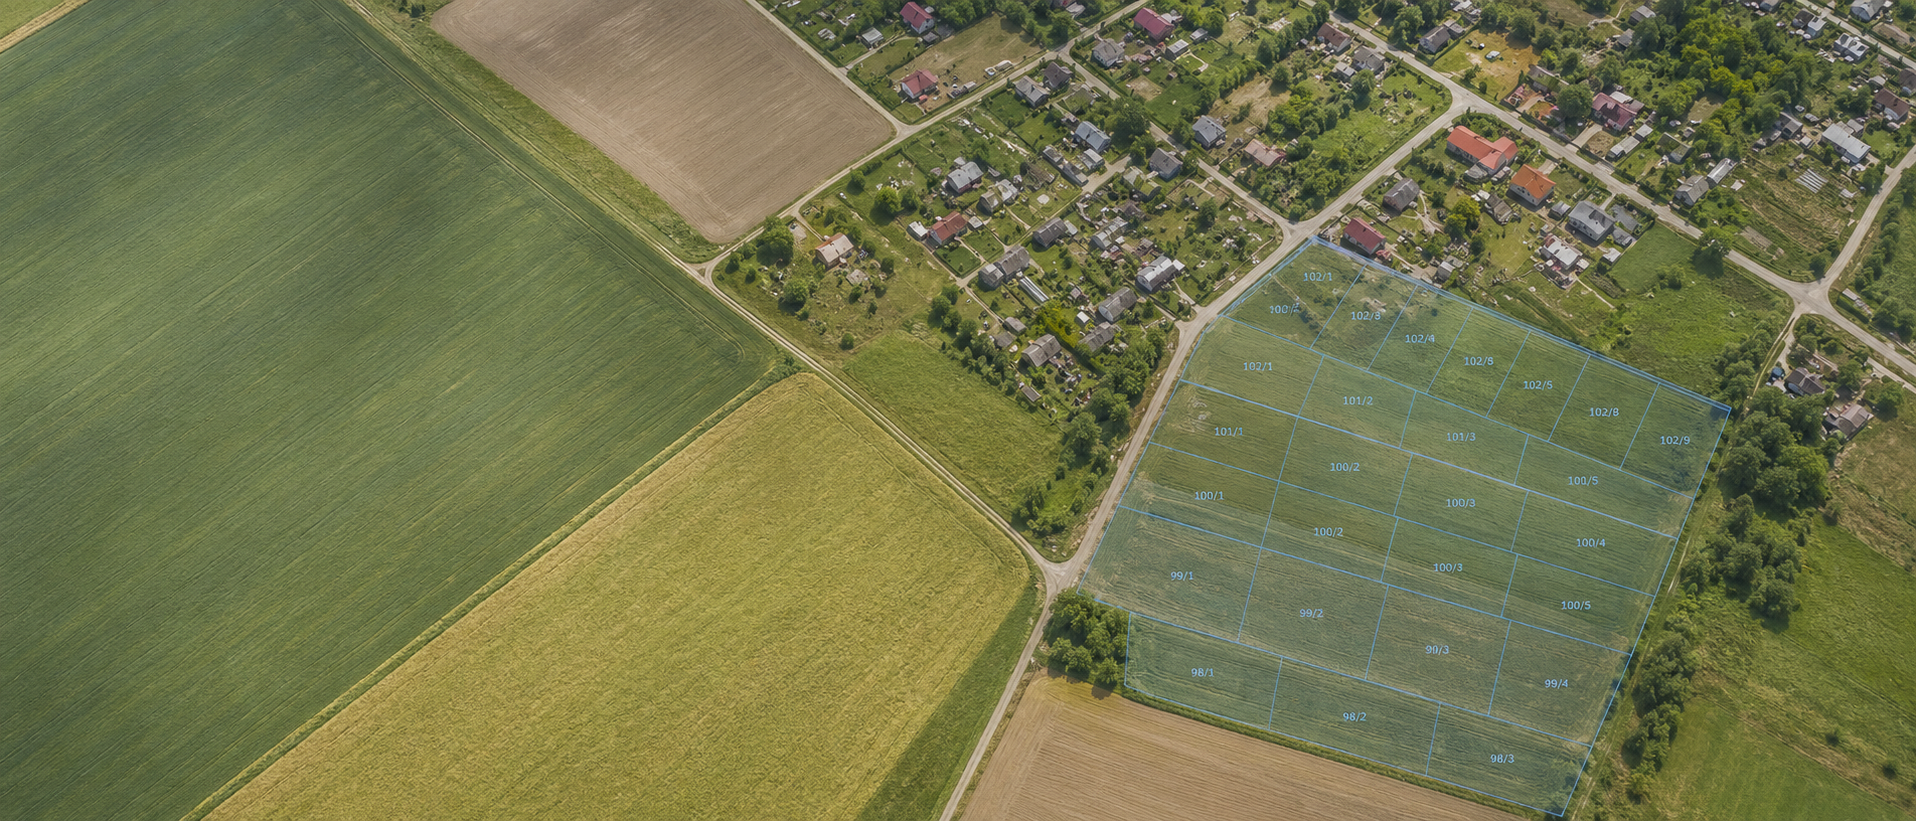
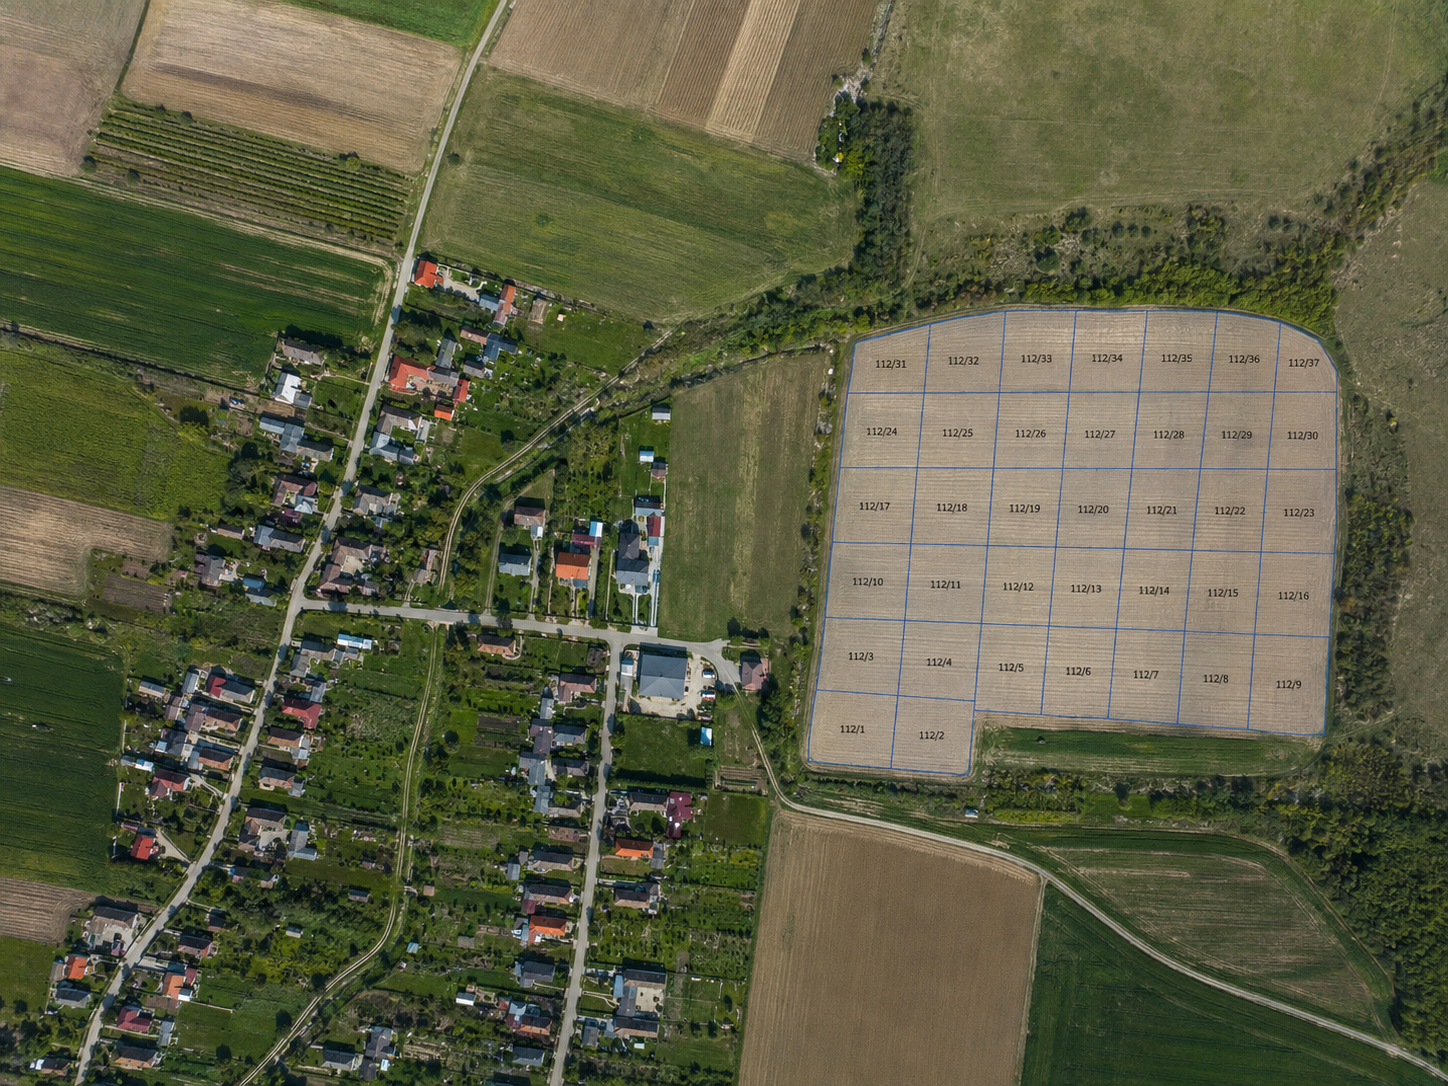
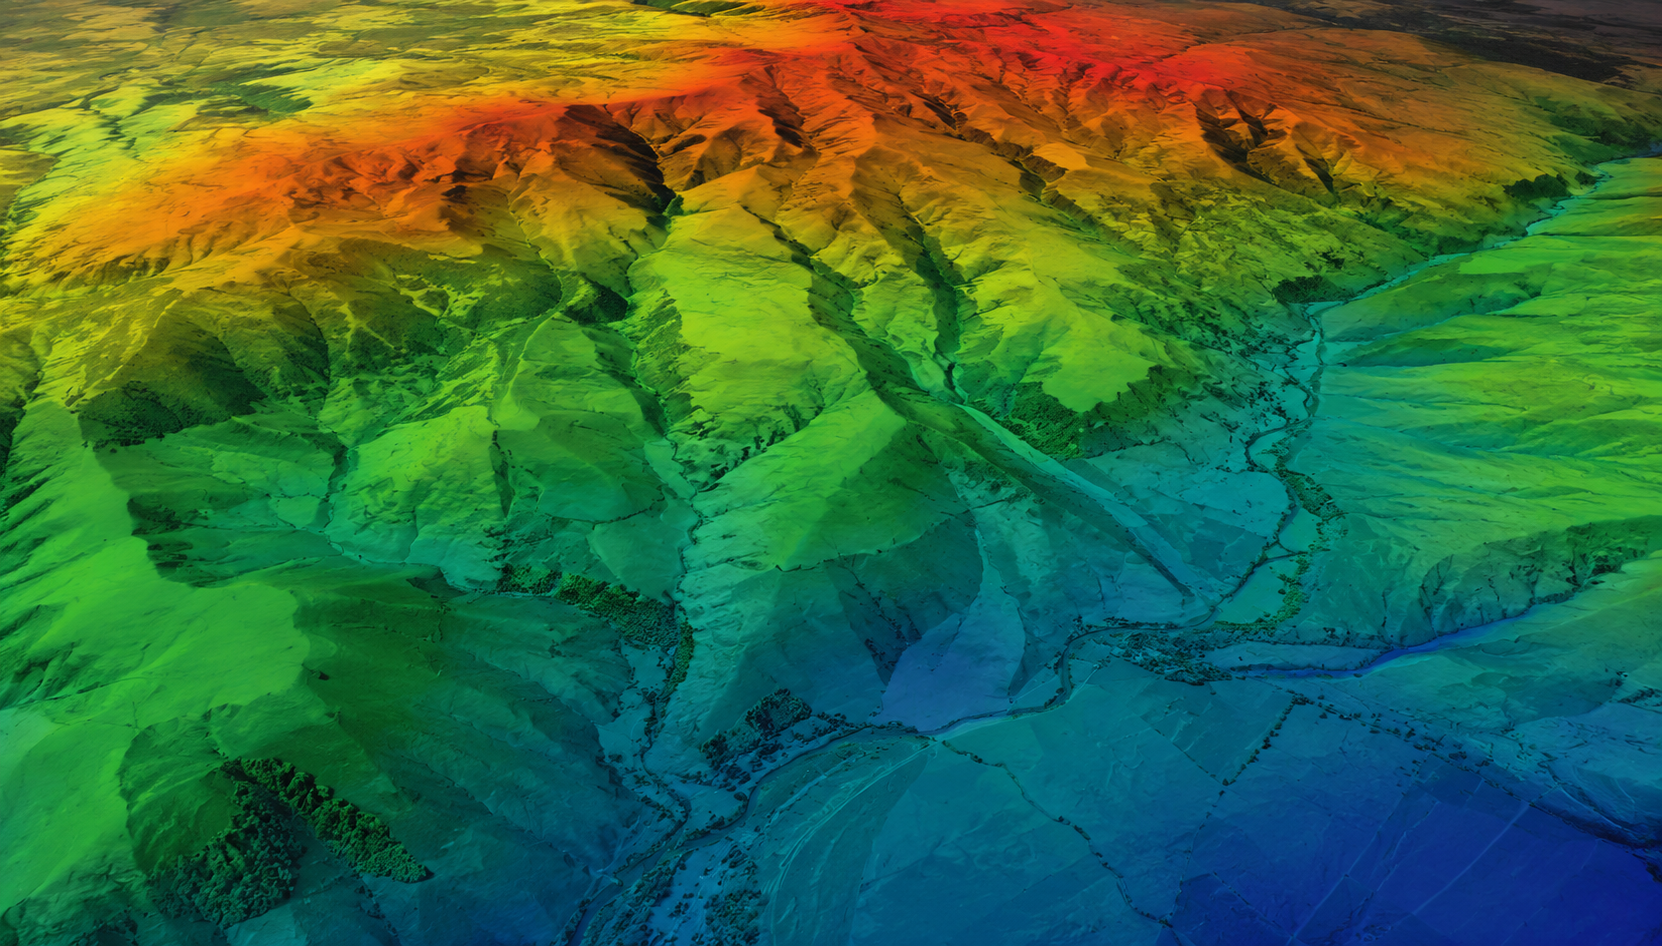
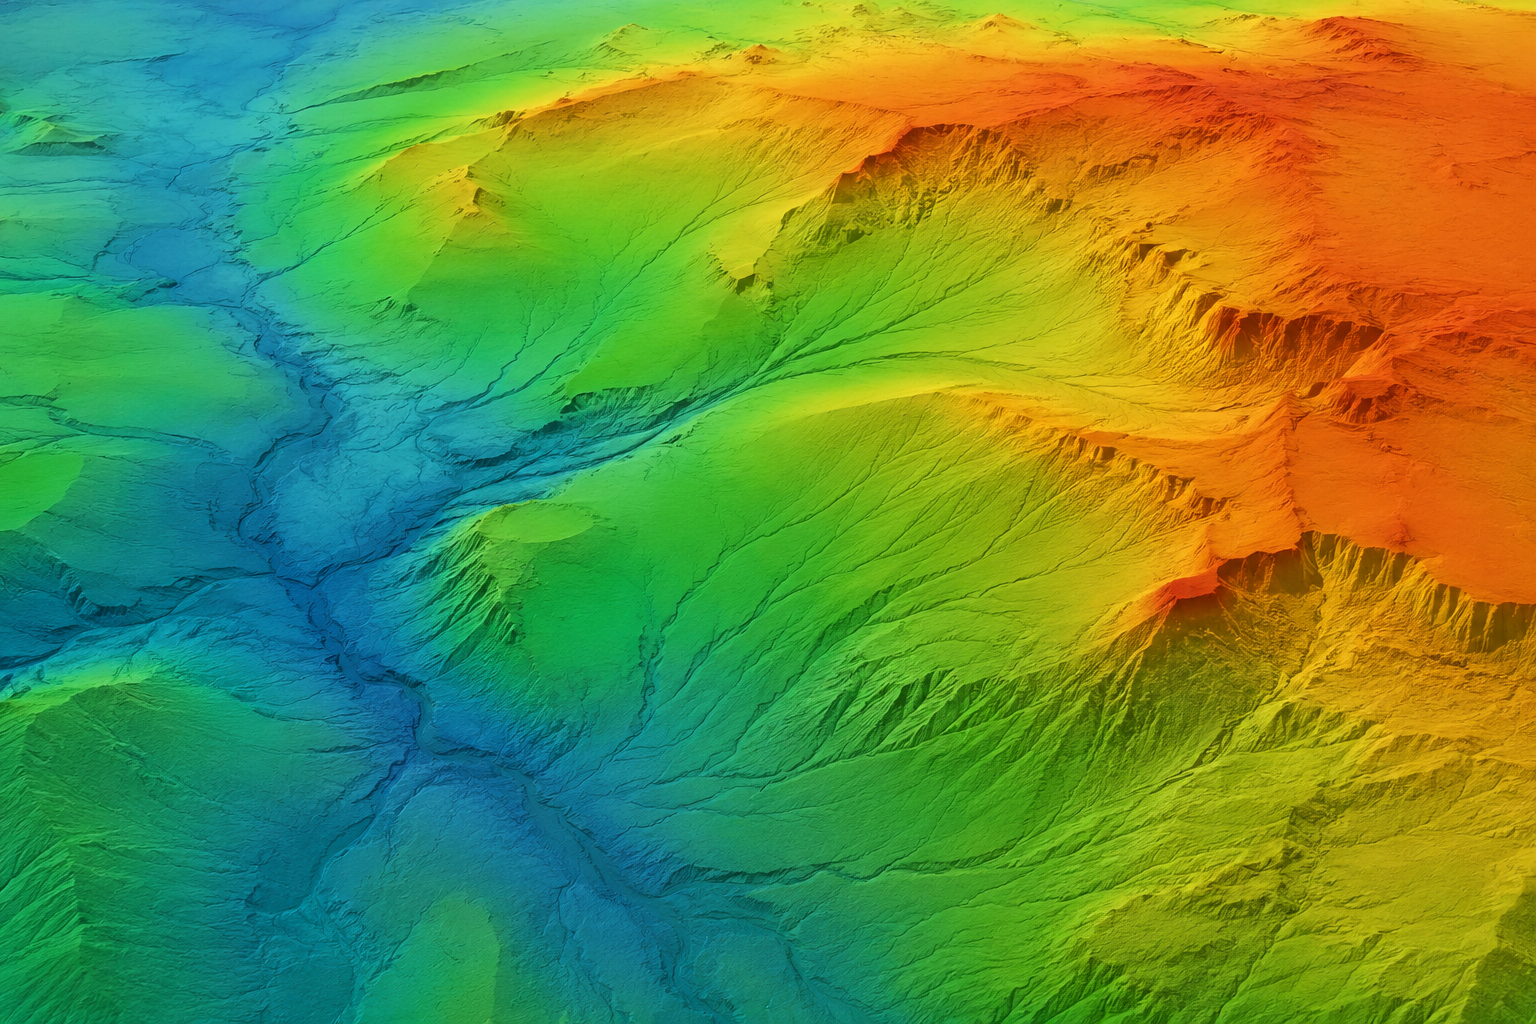
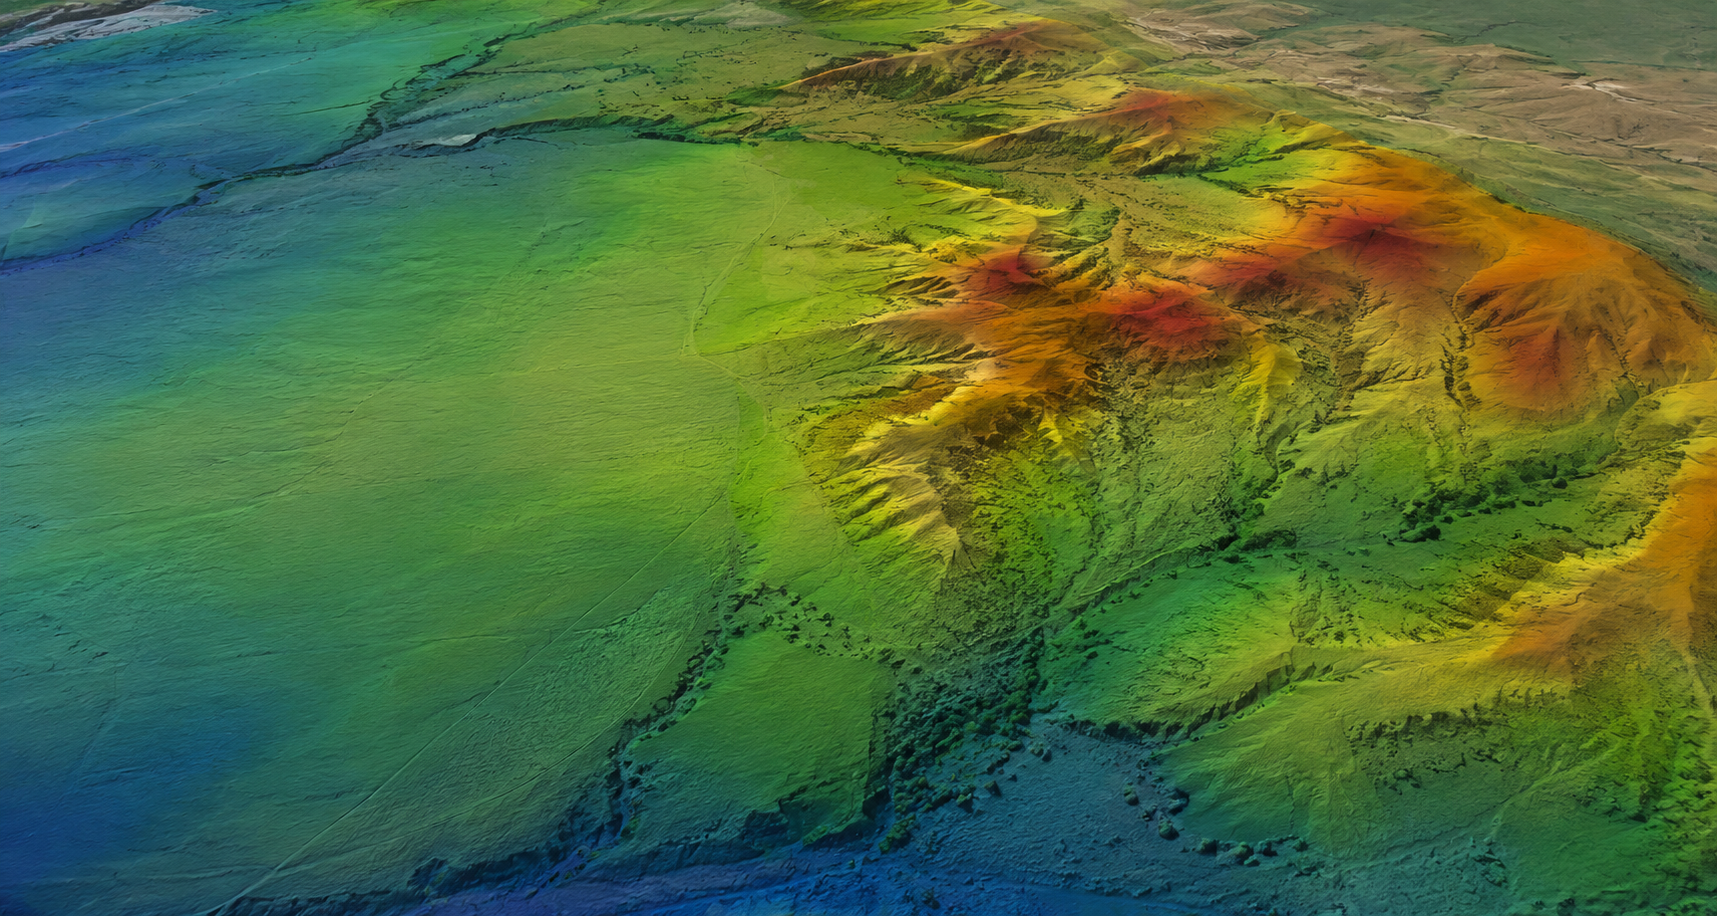
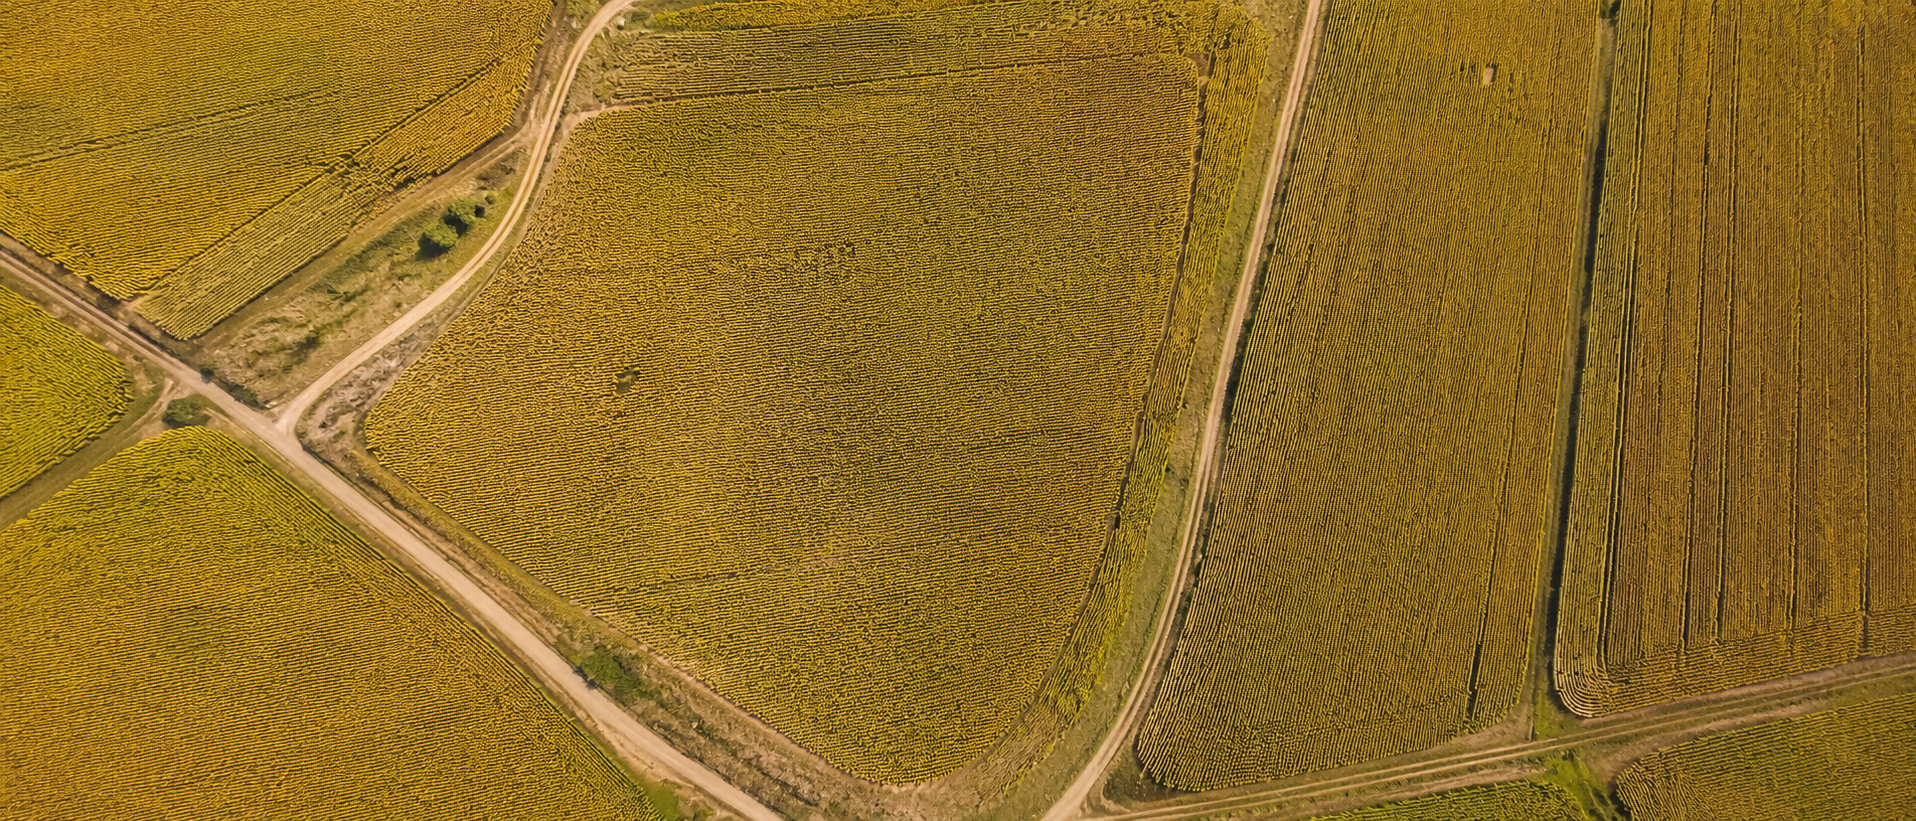
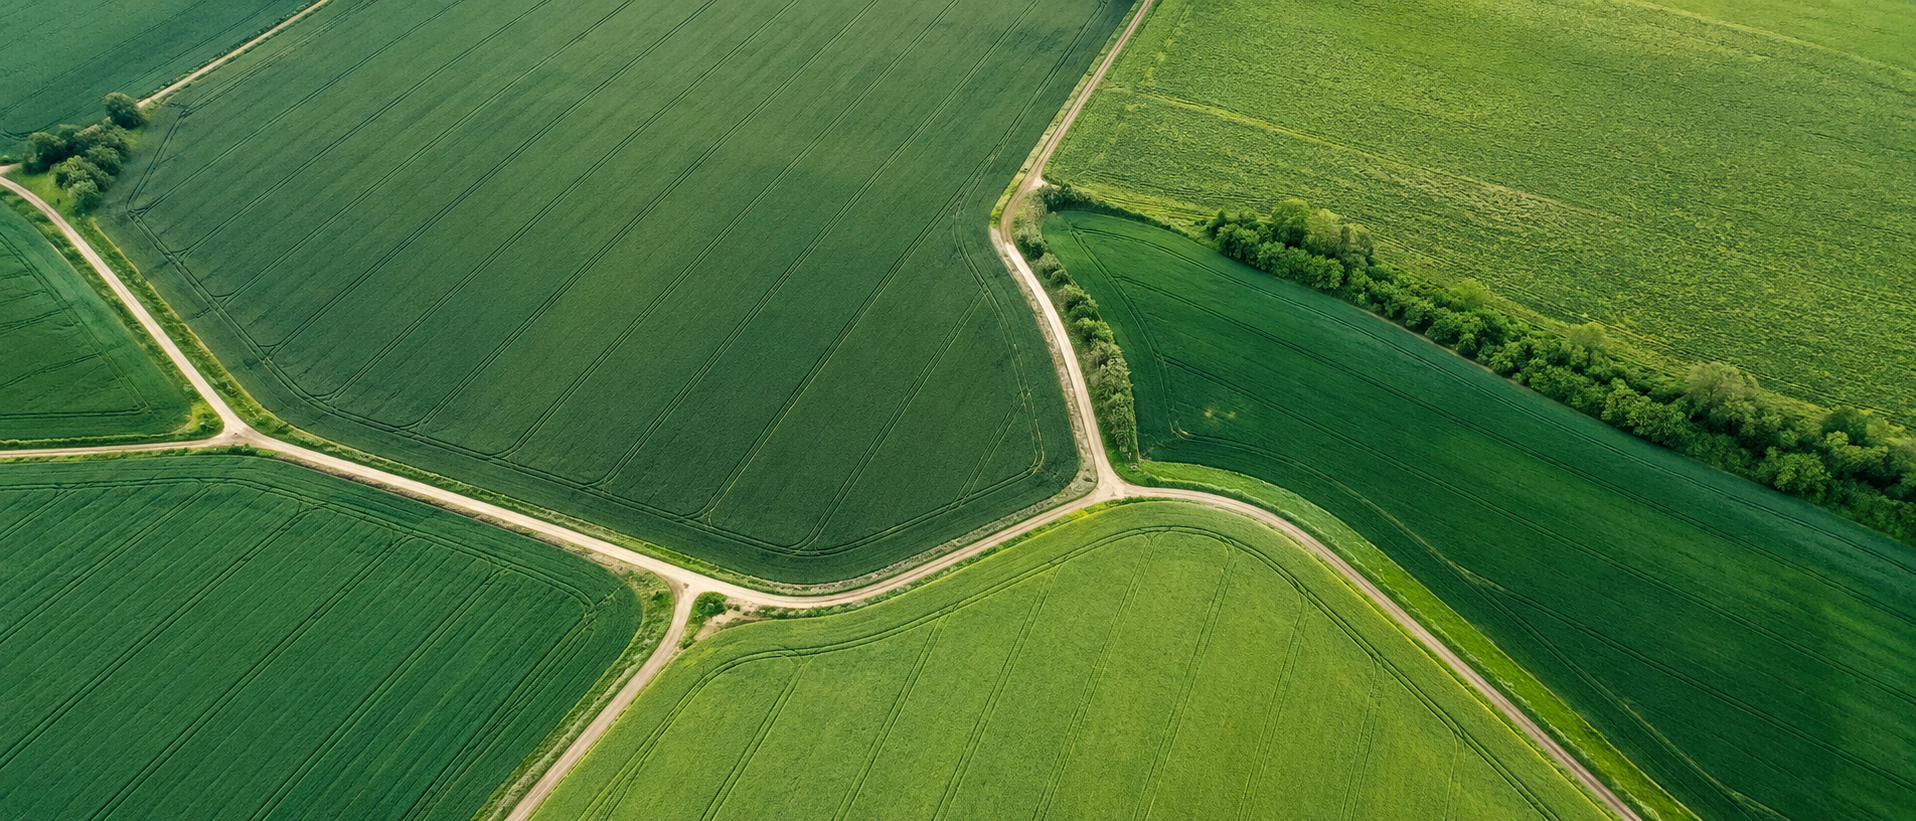
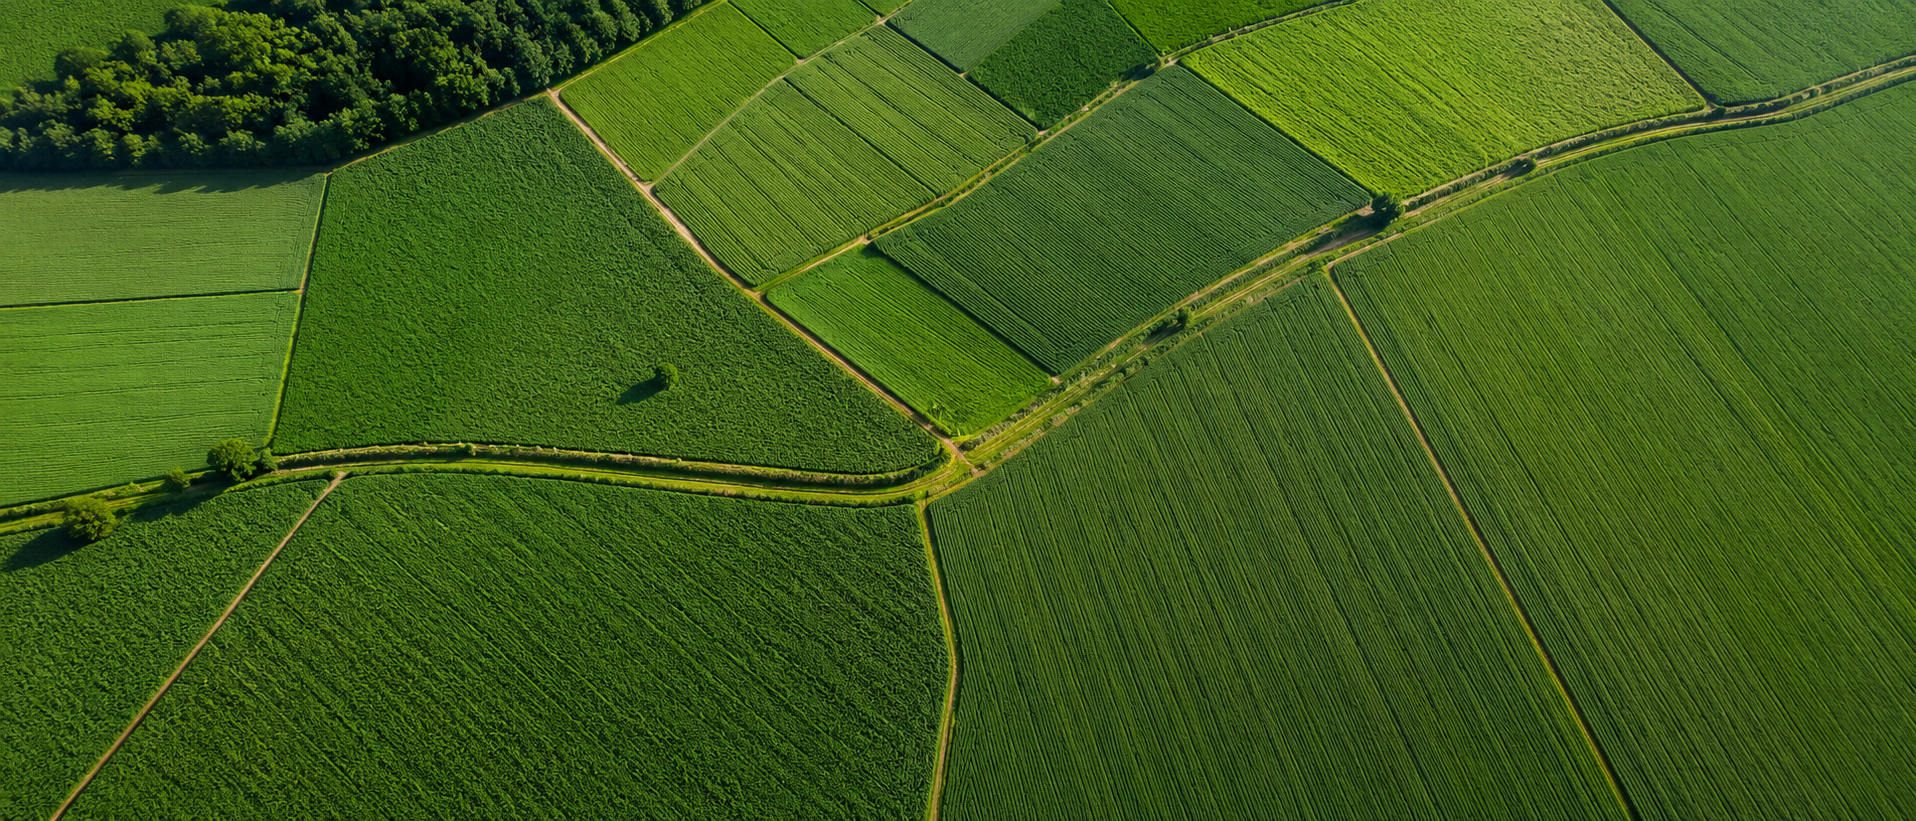
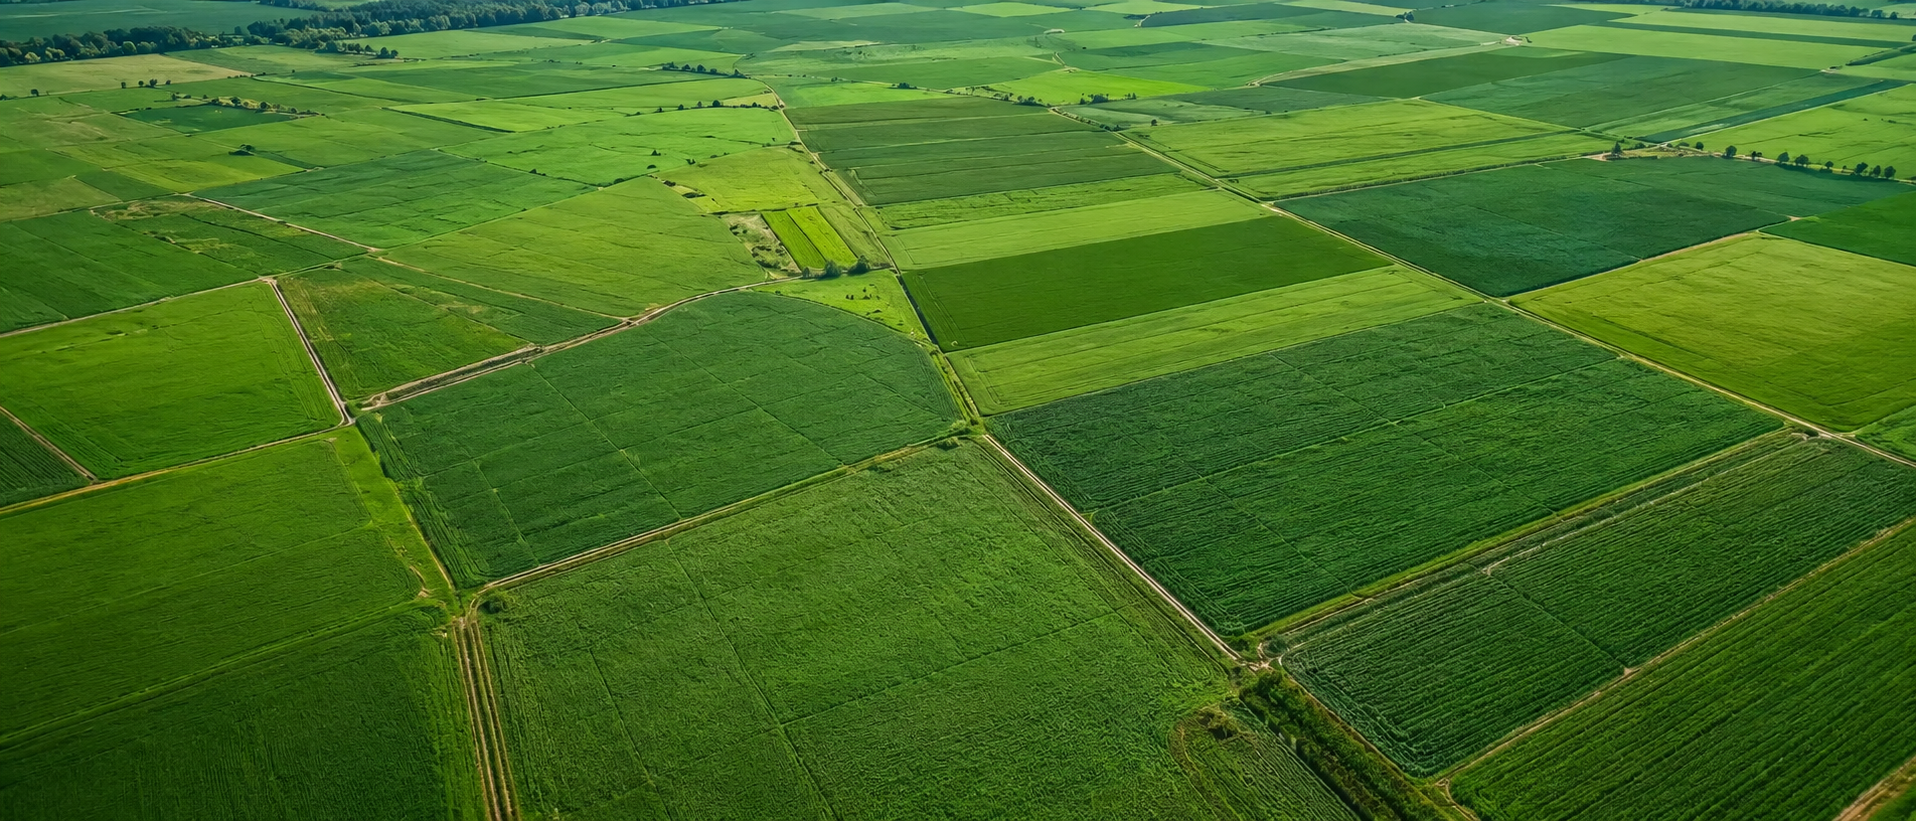
On live projects we have flown overlapping missions and produced geometrically robust, georeferenced mosaics ready for measurements, QA/QC and engineering packs.

Further detail

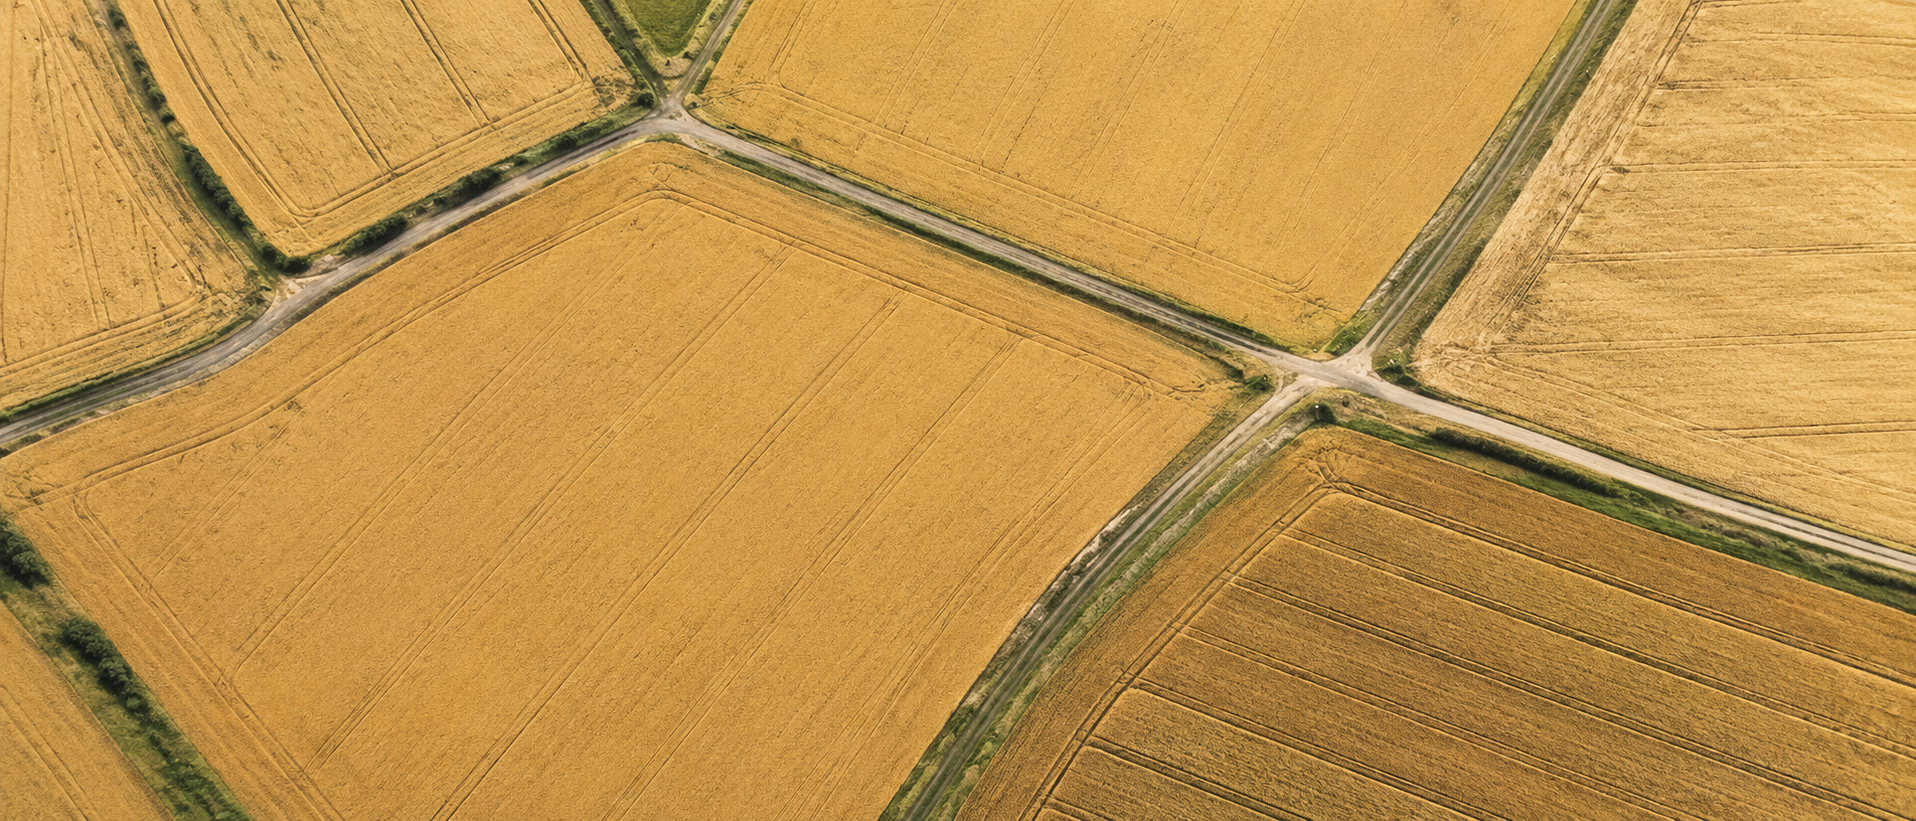
Production of accurate orthophoto maps from UAV aerial imagery. The drone captures overlapping vertical frames; imagery is processed into a single geometrically correct orthomosaic. An orthophoto is a high-resolution map-like image tied to coordinates—suited for measurements, asset analysis, and design documentation (unlike a simple oblique drone photo). Drone-supported work includes: • aerial capture from planned altitude; • autonomous flight along predefined routes; • overlapping image acquisition; • photogrammetric processing; • orthomosaic assembly; • georeferencing to the target coordinate system; • delivery of metric orthophoto products; • preparation of materials for topo/cadastral workflows; • roads, buildings, parcels, boundaries and infrastructure review; • change monitoring over time; • datasets for design, construction and spatial planning. Typical applications: • topographic surveys; • cadastral tasks; • land inventory / cadastral updating; • cartographic refresh; • built-up area analysis; • construction site monitoring; • territorial planning; • infrastructure monitoring. Related UAV capabilities often bundled with this track: • orthophoto mapping; parcel aerial surveys; high-resolution mosaics; image georeferencing; office processing; change detection; site monitoring; planning / land-administration datasets.

High-resolution orthophoto over farmlandAerial imagery stitched into a georeferenced orthomosaicGeospatial visualization aligned to parcel boundariesCartographic deliverable ready for cadastral & topo workflows

Proven delivery

Land inventory & tenure imagery packages

We have captured corridors, parcels, boundaries and structures so desk teams work from an up-to-date snapshot of ground truth.

Further detail

UAV campaigns to gather up-to-date evidence on parcels, buildings, roads, boundaries, structures and actual land use. Drones quickly provide a comprehensive visual snapshot of a plot or a large estate—supporting land inventories, factual compliance checks, cadastral dossiers and desktop analytics. Drone-supported work includes: • area overflights for fresh observations; • imagery of parcels, fields, roads and structures; • documentation of de-facto boundaries; • feature extraction across the site; • built vs. vacant zone delineation; • coverage of agricultural, residential and infrastructure assets; • inventory-ready deliverables; • qualitative assessment of site condition; • comparison against legacy plans or orthophotos; • datasets for cadastral, surveying and office processing teams. Typical applications: • parcel inventories; • cadastral analytics; • verification of actual land use; • built-environment studies; • change detection reporting; • reporting packages for authorities or boards; • agricultural / industrial estate inspections; • monitoring roads, fields and utility corridors. Related UAV capabilities: • inventory-grade imagery; cadastral/topographic drones; office processing; infrastructure analytics; land-management datasets; environmental screening inputs.

Aerial overview supporting parcel inventoryInfrastructure and access corridors captured from aboveVisual evidence for boundaries and land use patternsSupporting imagery for cadastral review cycles

Proven delivery

Digital elevation & terrain surface models

Our captures have fed DEMs/DTMs plus derivative contours for slope analysis, drainage insight and volumetric checks.

Further detail

Digital elevation models (DEM / DTM / DSM) derived from UAV imagery. High-detail flights feed photogrammetry to build dense point clouds, surface meshes and contour-ready derivatives. Models support slope analysis, cut/fill volumes, drainage modelling, terrain stability screening and engineering design. Drone-supported work includes: • aerial acquisition tailored for terrain modelling; • height and surface geometry capture; • photogrammetric adjustment; • dense point cloud generation; • DEM / DSM / DTM production; • 3D surface meshes; • height difference analysis; • slope, gully and depression interpretation; • contour and elevation mapping; • earthwork quantity preparation; • landscape process indicators; • ecological / territorial planning datasets. Typical applications: • geodesy and topography; • engineering surveys; • road & utility design; • construction planning; • environmental studies; • terrain condition audits; • soil volume estimates; • storm-water conceptual modelling; • spatial planning programmes. Extended UAV service catalogue (reference): • orthophoto mapping; parcel aerial surveys; high-resolution mosaics; coordinate georeferencing; land-inventory imagery; cadastral/topographic UAV missions; office processing; DEM/DSM/DTM & 3D surfaces; contour mapping; terrain variability analysis; construction monitoring; change detection; infrastructure analytics; field/road inspections; design & land-administration datasets; ecological / landscape analytics.

Terrain shading derived from drone survey dataElevation field contextualised across agricultural blocksSurface morphology highlighting relief variation

Drone videos

Our Drone Works

Short videos with real examples of aerial imaging, monitoring, and agricultural land analytics.

Sources

What we analyze

We combine scattered farm data into one field picture—from imagery to pump station sound. These are sources we routinely ingest and fuse with orthophotos plus field analytics.

Drone data

Photos, video, orthophotos, thermal maps and crop condition.

Satellite imagery

NDVI, EVI, vegetation dynamics and stress zones.

Field photography

Disease, weeds, damage and uneven growth.

Field video

Problem zones, equipment, animals, obstacles and events.

IoT sensor data

Soil moisture, temperature, light, pressure, pH and water level.

Weather data

Rainfall, heat waves, frost, wind and drought risk.

Machinery and GPS

Routes, idle time, field coverage and operation efficiency.

Spreadsheets and reports

Excel, CSV, journals, yield, costs and operations.

Audio

Equipment, pumps, animals, ambient and alarm sounds.

Platform

Core solutions

From spectral indices to operational BI reports—we cover the full loop: data, analytics, forecasting and field actions.

Selected focus

Crop condition analytics

  • Weak growth zones and heterogeneity
  • Vegetation density and sector comparison
  • Crop development dynamics
  • Stress zones from spectra and history

We turn farm data into clear decisions: where to irrigate and fertilize, where disease risk appears, where the field lags, where yield may be lost and where machinery underperforms.

Dashboards

Interactive BI field view

One panel: risk map, index dynamics, KPIs and zones to review. Filters adjust the demo view.

Filters

Analysis context

Map mockup

Field map · focus zones

Wheat · All fields · 7 days

Low risk Medium High

NDVI dynamics

Soil moisture (weekly demo)

Yield forecast

Total area

1,240 ha

Average NDVI

0.73

Risk zones

18

Yield forecast

6.8 t/ha

Potential losses

7.4%

Water stress

12%

To inspect

5 zones

Analysis type

NDVI

AI recommendations

  • Review zone NE-04 within 48 hours — elevated risk for the selected level: all levels.
  • Adjust irrigation for the chosen crop in zones with higher NDVI dispersion.
  • Schedule a control flight for the selected field — selected period: All fields · 7 days.
ZoneFieldRisk
Z-NE-04Field 12High
Z-C-09Field 07Medium
Z-SW-02Field 03Low
Uneven irrigation and NDVI drop · Localized crop stress · Spot check recommended

Drones

Drones turn the field into a decision map

We use drone imagery and video to assess crop health, build maps, spot uneven growth, drought, disease, weeds and damage.

Flight telemetry

Mission · 120 m

Coverage 98%
Orthophoto · GSD 3.2 cm/pixelWind 4 m/s

Module

RGB analysis

Module

Multispectral index

Module

Crop stress zones

Module

Weed detection

Module

Irrigation gaps

Module

Field coverage

Processing pipeline

  1. 1

    Field flight

    Automated pipeline stage with data quality controls.

  2. 2

    Data upload

    Automated pipeline stage with data quality controls.

  3. 3

    Image processing

    Automated pipeline stage with data quality controls.

  4. 4

    AI analysis

    Automated pipeline stage with data quality controls.

  5. 5

    Problem zone map

    Automated pipeline stage with data quality controls.

  6. 6

    Report and recommendations

    Automated pipeline stage with data quality controls.

Computer vision

Field video analytics

We turn continuous frames into events: equipment, growth anomalies, missed passes and route deviations.

FieldCam AI · stream / hdr-on
Live inference
Tractor detected
Crop anomaly
Water stress zone

Movement trace · coverage gap

  • Machinery detection in the field
  • Tractor tracking
  • Sector coverage analysis
  • Missed application detection
  • Animal detection
  • People or object detection
  • Crop condition from video
  • Automatic highlight clips
  • Before/after operation comparison

Event log

  • 08:12

    Missed application detected

  • 08:34

    Weak growth zone

  • 09:10

    High weed density

  • 09:42

    Equipment left route

Signal intelligence

Audio analytics for agriculture

Audio is often ignored yet it anticipates issues: pumps sound different, engines run rough, livestock behave oddly, equipment starts off-schedule. We turn sound into monitoring data.

Waveform

Continuous stream · 48 kHz

Risk: elevated

Spectrogram (simplified)

Frequency profile

Events

Pump anomaly detected

Classification from audio features

High

Engine vibration pattern

Classification from audio features

Medium

Livestock noise increase

Classification from audio features

Low

Night activity alert

Classification from audio features

Medium

Irrigation system active

Classification from audio features

Low
Useful for pump stations, generators, machinery, livestock facilities and remote IoT microphones.

Cases

AgroData in practice

Short vignettes—scale, problem, outcome. Replace placeholders with real stories anytime.

Row crops

Crop monitoring

Spectral cues, stress alerts, and agronomy-ready summaries.

Outcome · placeholder

Large estate

Single pane of glass

Fields, machinery, and weather stitched for daily ops.

Outcome · placeholder

Risk & quality

Early anomaly detection

Video/AI checks plus alerting playbooks to reduce losses.

Outcome · placeholder

Digital twin

Field digital twin

Interactive model merging drones, satellite, sensors, weather, machinery, photos, video and agronomist reports—to see each sector’s status, history and decision impact.

Layer stack

Data layers on the map

2D field tessellation

Current sector status · Change history · Yield forecast

What the twin shows

  • Disease and drought risk
  • Action recommendations
  • Irrigation and fertilizer maps
  • Zones to scout
  • Machinery efficiency
  • Financial impact of decisions

Next best action

Targeted scout of the vegetation dip zone and trim irrigation by 6–8% on the next cycle.

AI recommendations

  • Review northeast field sector within 48 hours
  • Reduce irrigation on sector B4
  • Schedule an extra flight over sector C2
  • Leaf disease probability: 68%
  • Potential yield loss: 4.2%

Powered by stan.com.ar